Expired October 31, 2020 3:59 AM
Already unlocked? for access
Protected ContentThis content can only be viewed in authorized regions: Maryland, District Of Columbia, Virginia, West Virginia, Pennsylvania, Delaware, New Jersey, New York.
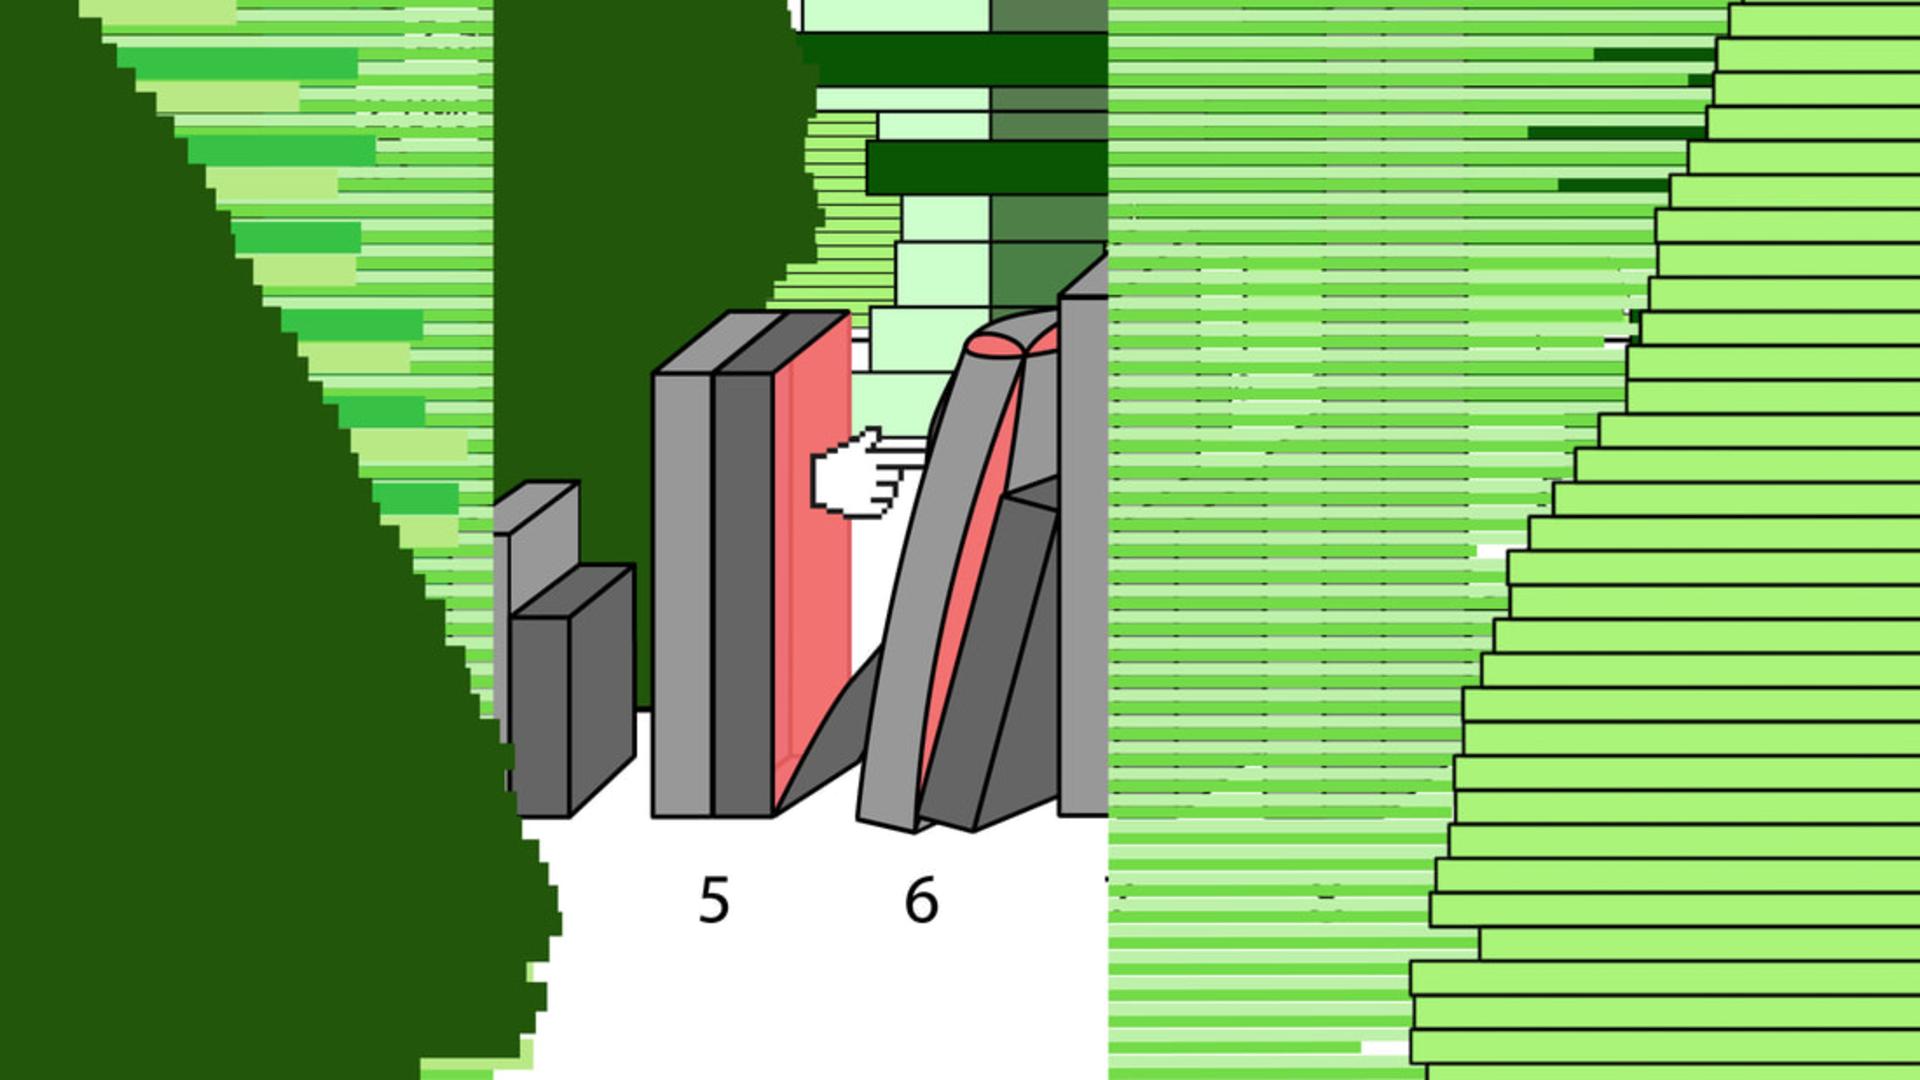
During a PowerPoint presentation, statistical diagrams are breaking free from the strait-jacket of their coordinates. A trip into the sensual world of statistics begins. Pie charts are melting, arrow diagrams twisting, scatter plots, bar graphs and stock market curves join in a collective climax.
- Year2019
- Runtime00:07:03
- LanguageNo Dialogue
- CountrySwitzerland
- DirectorMaja GEHRIG
10 films in package
Protected ContentThis content can only be viewed in authorized regions: Maryland, District Of Columbia, Virginia, West Virginia, Pennsylvania, Delaware, New Jersey, New York.
During a PowerPoint presentation, statistical diagrams are breaking free from the strait-jacket of their coordinates. A trip into the sensual world of statistics begins. Pie charts are melting, arrow diagrams twisting, scatter plots, bar graphs and stock market curves join in a collective climax.
- Year2019
- Runtime00:07:03
- LanguageNo Dialogue
- CountrySwitzerland
- DirectorMaja GEHRIG